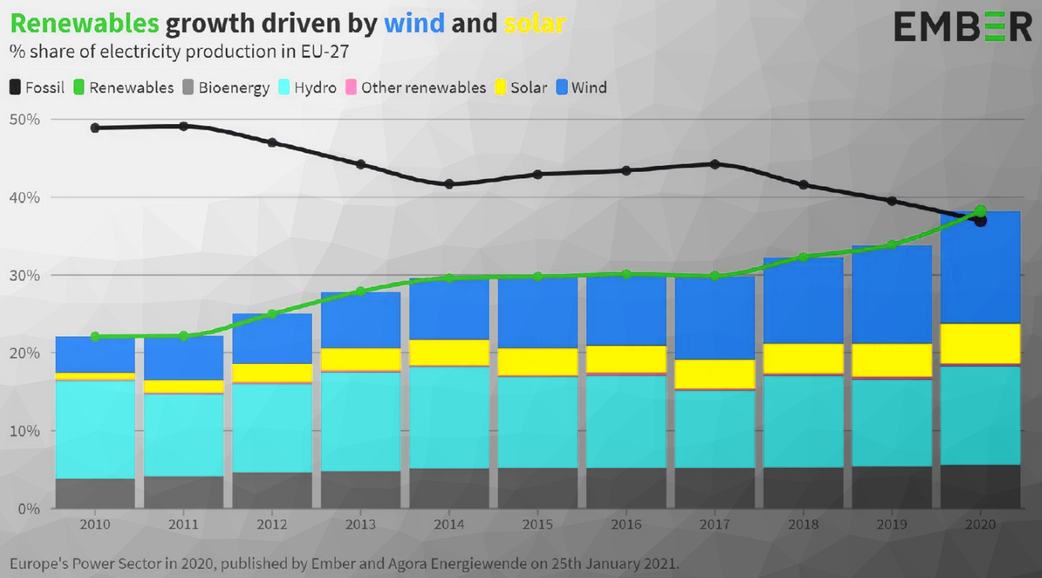
For the first time, renewables have overtaken fossil fuels to become the EU’s main source of electricity in 2020. This is an important step in the transformation of European electricity generation, but only a small one compared to the planned goal of 55 % greenhouse gas reductions by 2030 and climate neutrality by 2050 in Europe.
The EU countries will need huge investments in infrastructure to transport renewable energies from the locations of their generation to the locations of consumption. Furthermore, for the desired transformation of European electricity generation, both pricing and taxation of energies (and greenhouse gas emissions) need to be coordinated such that the EU remains competitive and effective incentives are set.
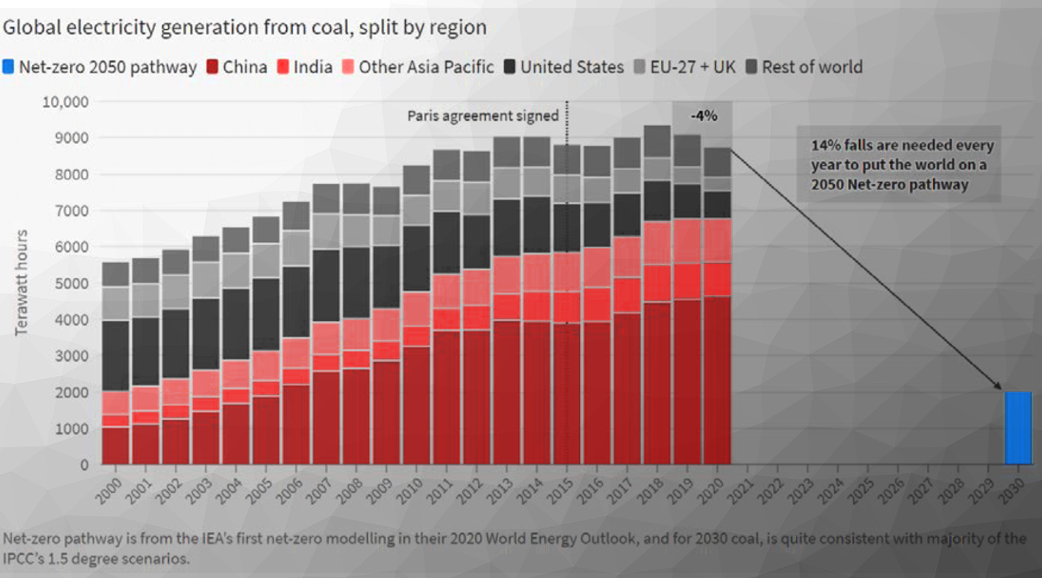
Global data also show that the overall electricity transition is not progressing in line with climate targets. Clean power generation is not yet being built fast enough to keep pace with the rising electricity demand. Wind and solar power plants make up the bulk, but their growth has slowed in recent years. Even the temporary drop in electricity demand due to the COVID-19 pandemic is not enough to put the world on track and electricity demand will undoubtedly pick up soon, especially as the world seeks to electrify all sectors that still rely on fossil fuels. Solutions and more ambition worldwide are needed urgently.
European Union
The chart below shows the EU’s energy sources since 2020.
The graph below shows the ratio of renewable to fossil energy sources in various European countries in 2020.
.PNG)
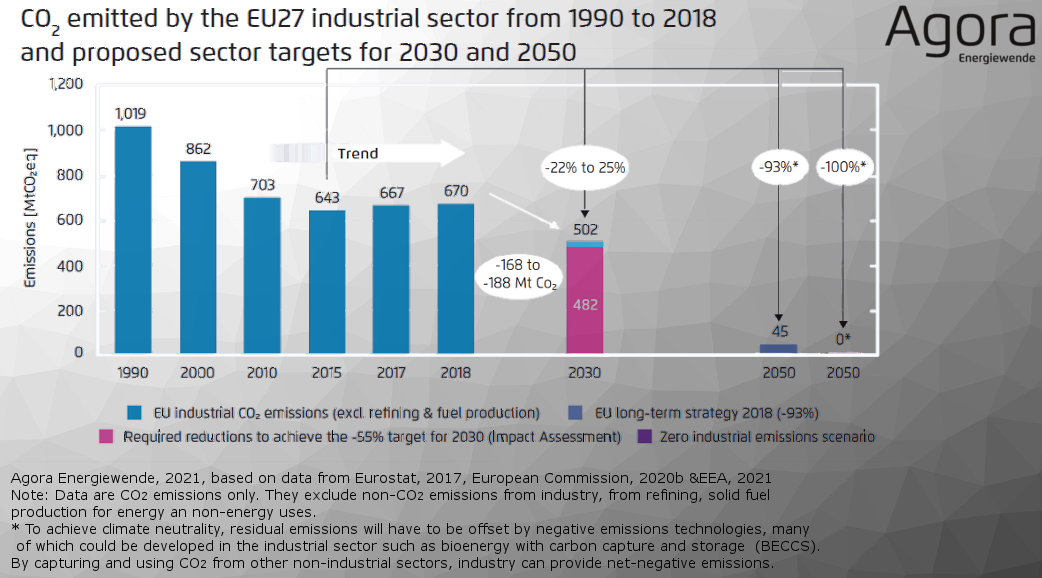
The EU has set itself the goal of becoming climate neutral by 2050. The graph below shows the targets for 2030 and 2050 compared to the CO2 emissions since 1990.
The graph below shows electricity prices in Euro per kWh in different European countries. The extreme differences are an important aspect for competitiveness.
.PNG)
World
The graph below shows the ratio of renewable to fossil energy sources in various G20 countries in 2020.
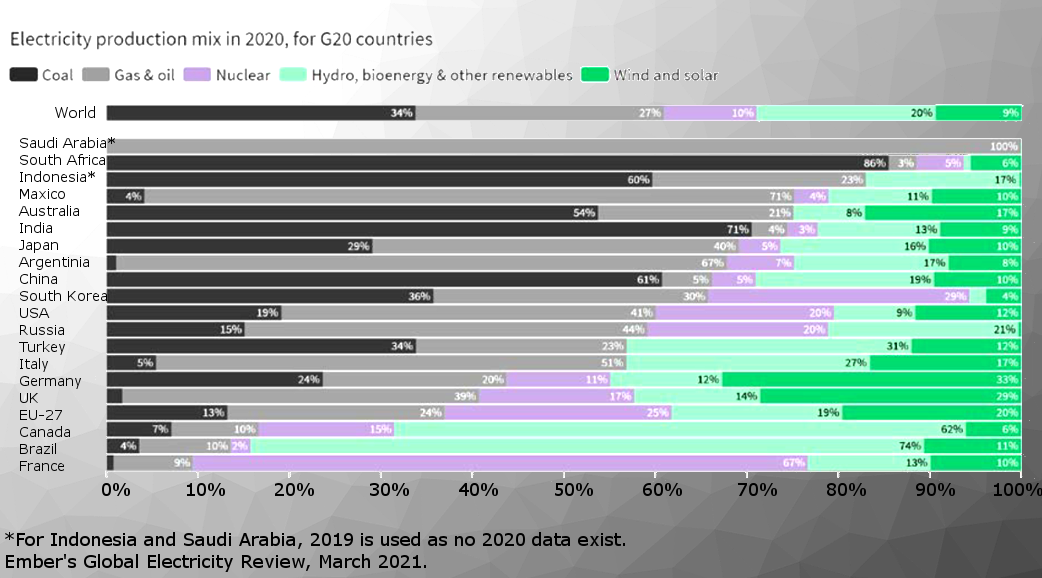
The chart below shows the world’s dependence on fossil fuels and how the energy needs of individual regions compare.
References
- Agora Energiewende and Ember, The European Power Sector in 2020: Up-to-Date Analysis on the Electricity Transition, January 2021.
- Dave Jones, Global-Electricity-Review-2021, March 2021.
- Electricity price statistics, Eurostat April 2021. (accessed May 31, 2021)
Also of Interest
- The New EU Chemicals Strategy,
ChemistryViews 13 May 2021.
https://doi.org/10.1002/chemv.202100040
![]()