
During the last ten years the global area of biotech crops almost tripled from 59 to 170 Million Has. The US continues to be the largest producer of biotech crops with 69,5 Million Has, followed by Brazil and Argentina, with 36,6 and 23,9 Million Ha, respectively.
Planted biotech crops are either characterized by herbicide tolerance (60 %) or insect resistance (15 %). 25 % of the planted biotech crops carry a combination of herbicide tolerance and insect resistance [1].
Although 80–90 % of all seeds planted by farmers are not bought from companies, the commercial market for seeds is significant with a total of 34,5 Million US$ in 2011. It is dominated by few seed selling companies only [2].
Total Increase of Biotech Crops Worldwide
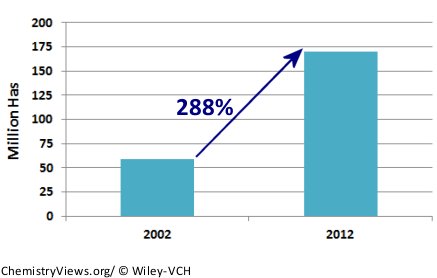
Source: 2012 ISAAA Report on Global Status of Biotech/GM Crops
Biotech Crop Countries 2012
.jpg)
Source: 2012 ISAAA Report on Global Status of Biotech/GM Crops
Adoption by Crop 2012
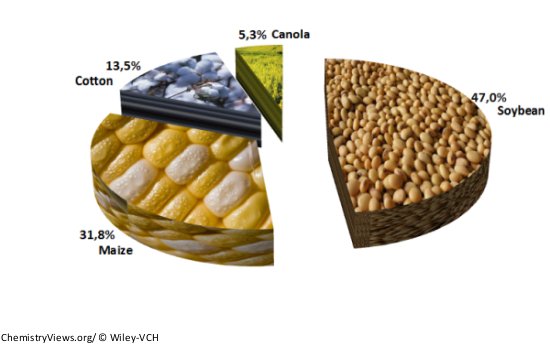
Source: 2012 ISAAA Report on Global Status of Biotech/GM Crops
Adoption by Trait 2012
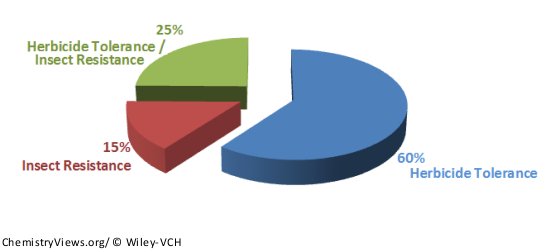
Source: 2012 ISAAA Report on Global Status of Biotech/GM Crops
Global Seed Sales by Companies 2011
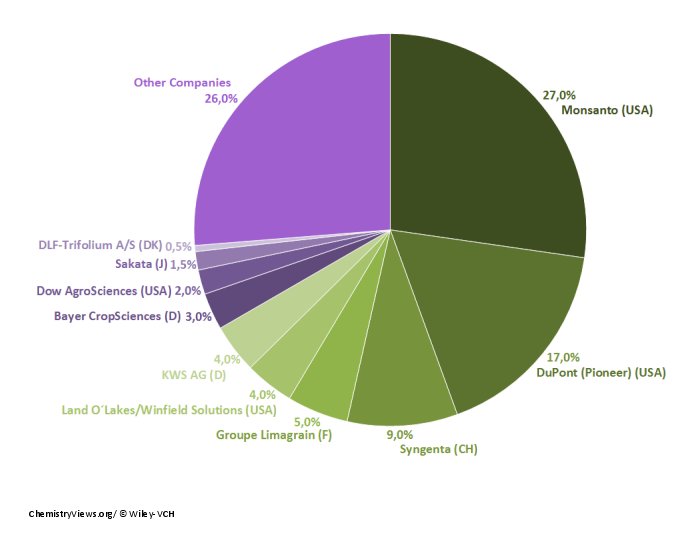
Source: ETC Group 2011
References:
[1] C. James, 2012 ISAAA Report on Global Status of Biotech/GM Crops, International Service for the Acquisition Of Agri-biotech Applications (ISAAA), 2012.
[2] ETC-Group News Release, Gene Giants seek “Philanthrogopoly”, ETC-Group, Ottawa 2013.
Also of interest:
- Interview with D. Gustafson – Senior Fellow at Monsanto Company,
ChemViews Magazine 2011.
DOI: 10.1002/chemv.201000106 - Plant Biotech Trends 2011
- All Industry Roundups