The CWTS Leiden University Ranking for 2022 has been published by the Centre for Science and Technology Studies, Leiden University, The Netherlands. The Leiden Ranking is based on bibliographic data from the Web of Science database by Clarivate Analytics. It provides a rating that is based on the absolute number of top-cited publications (which is size-dependent), as well as a size-independent list, where the performance of a university’s publications is measured relative to its publication output. This year’s list includes 1,318 universities.
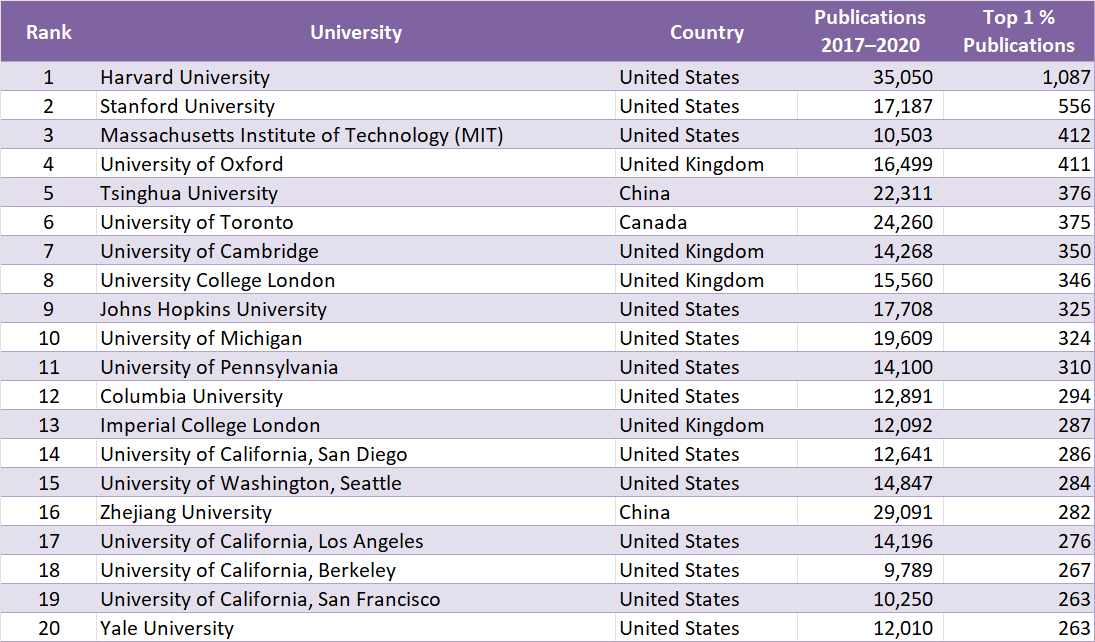
The top 20—based on the absolute number of publications that belong to the top 1 % most cited—consists mostly of institutions in the United States and the United Kingdom, in addition to one Canadian and two Chinese universities. The three highest-ranked universities overall are Harvard University, Stanford University, and the Massachusetts Institute of Technology (MIT), all USA. These top three have remained the same for the last eight years. The highest-ranked institution outside of the USA and the UK is Tsinghua University, China, in fifth place. The highest-ranked continental European institution is the Swiss Federal Institute of Technology (ETH) Zurich at rank 25.
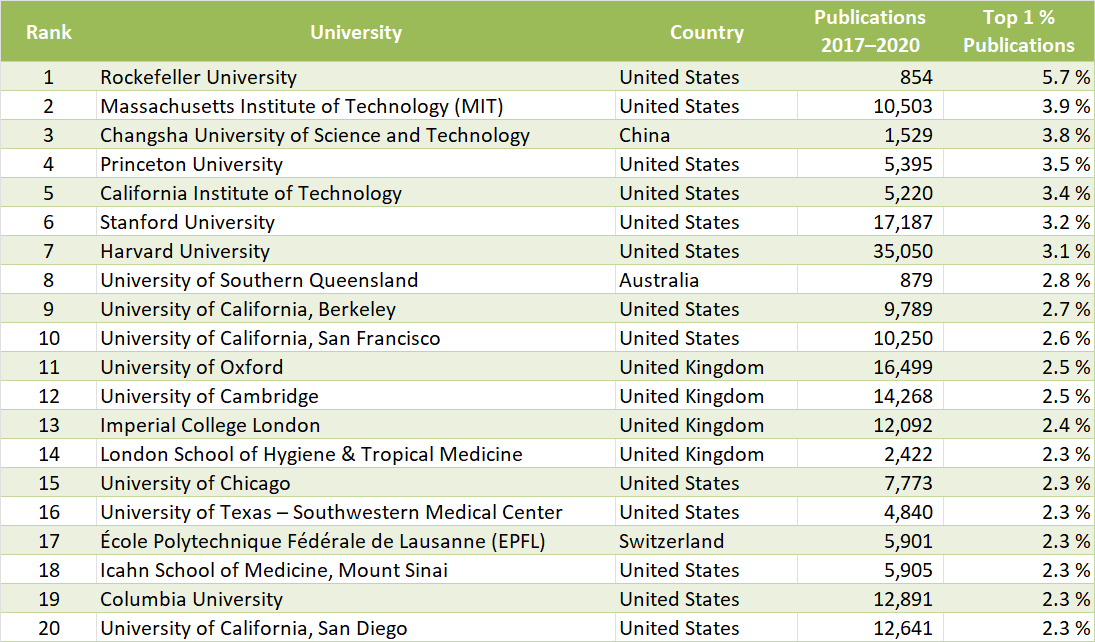
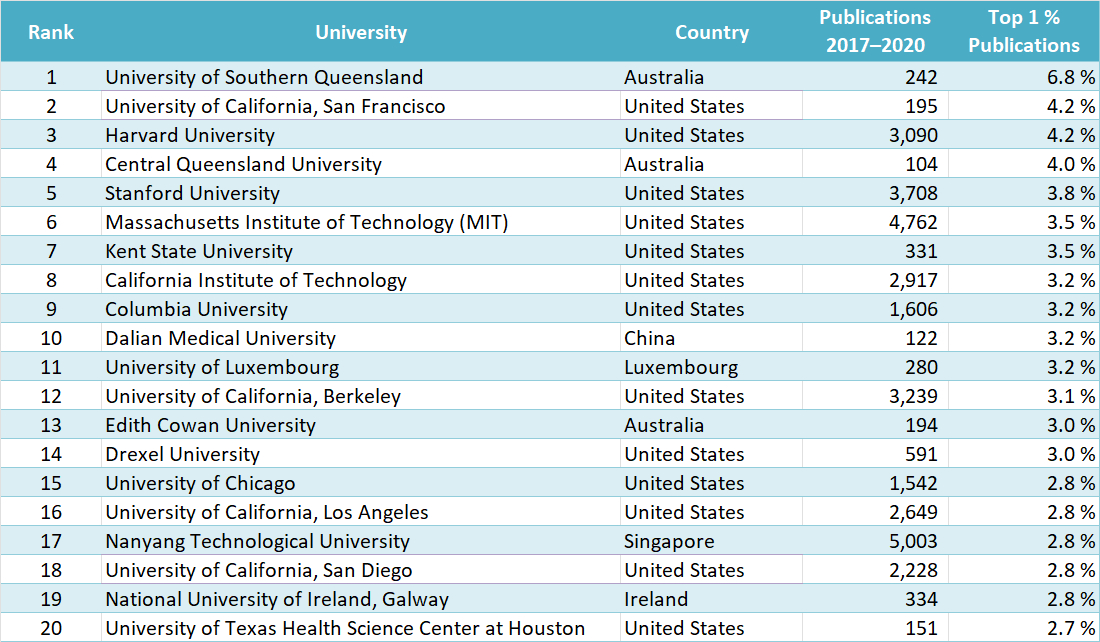
In the size-independent ranking (based on the proportion of publications that belong to the top 1 % most cited and a minimum output of 100 papers), Rockefeller University, USA, is ranked first, followed by MIT and Changsha University of Science and Technology, China. The top institution outside of the United States and China is the University of Southern Queensland, Australia, at rank 8. The highest-ranked continental European institution in this category is the Swiss Federal Institute of Technology (EPFL) Lausanne at 17th place.
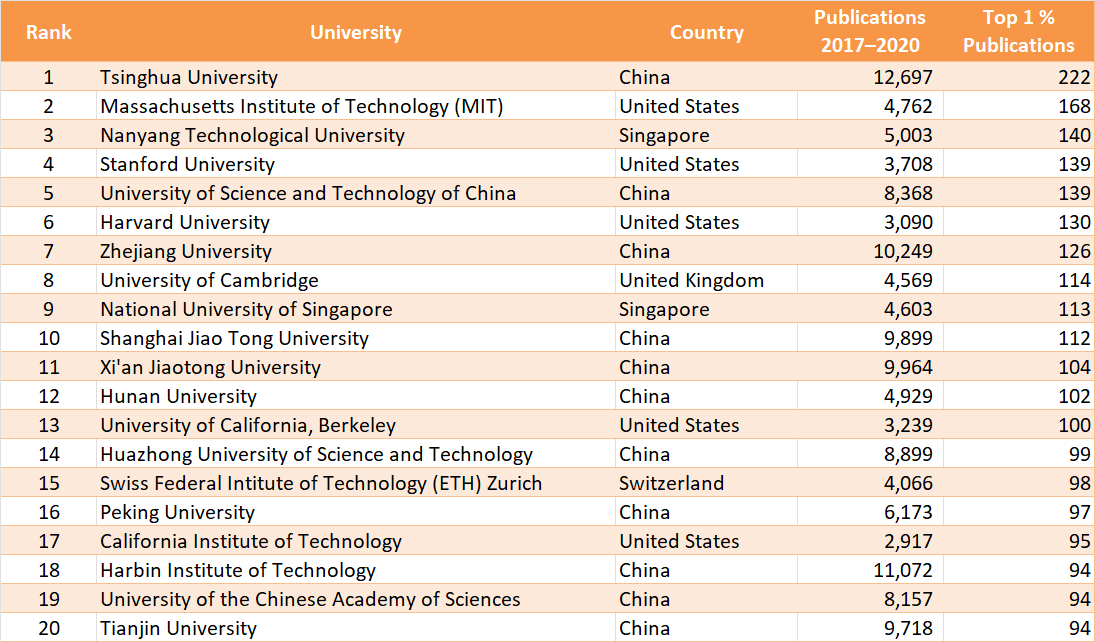
In the physical sciences, which include chemistry and related disciplines, the top rank in the size-dependent rating is held by Tsinghua University. In the size-independent ranking, the University of Southern Queensland placed first in these fields.
Size-Dependent Ranking (All Sciences)
(by the number of the university’s publications belonging to the top 1 % most frequently cited)
Size-Independent Ranking (All Sciences)
(by proportion of the university’s publications belonging to the top 1 % most frequently cited)
Size-Dependent Ranking (Physical Sciences and Engineering)
(by the number of the university’s publications belonging to the top 1 % most frequently cited)
Size-Independent Ranking (Physical Sciences and Engineering)
(by proportion of the university’s publications belonging to the top 1 % most frequently cited)
Methodology
The CWTS Leiden Ranking is based on bibliographic data covering the years 2017–2020 from the Web of Science database produced by Clarivate Analytics. Book publications, publications in conference proceedings, publications in journals not indexed in Web of Science, and publications in languages other than English are not included.
The ranking offers the following indicators of the scientific impact of a university:
- P
The total number of publications of a university - P(top 1 %) and PP(top 1 %)
The number and the proportion of a university’s publications that, compared with other publications in the same field and in the same year, belong to the top 1 % most frequently cited - P(top 5 %) and PP(top 5 %)
The number and the proportion of a university’s publications that, compared with other publications in the same field and in the same year, belong to the top 5 % most frequently cited - P(top 10 %) and PP(top 10 %)
The number and the proportion of a university’s publications that, compared with other publications in the same field and in the same year, belong to the top 10 % most frequently cited - P(top 50 %) and PP(top 50 %)
The number and the proportion of a university’s publications that, compared with other publications in the same field and in the same year, belong to the top 50 % most frequently cited - TCS and MCS
The total and the average number of citations of the publications of a university - TNCS and MNCS
The total and the average number of citations of the publications of a university, normalized for field and publication year. An MNCS value of two, for instance, means that the publications of a university have been cited twice above the average of their field and publication year.
The ranking also includes indicators for collaboration, open access publishing, and gender diversity. It provides statistics for the following five fields of science:
- Biomedical and health sciences
- Life and earth sciences
- Mathematics and computer science
- Physical sciences and engineering
- Social sciences and humanities
- CWTS Leiden Ranking 2022,
Centre for Science and Technology Studies, Leiden University, The Netherlands
Also of Interest
- CWTS Leiden Ranking 2021,
ChemistryViews.org 2021.
Scientific performance of over 1200 universities assessed based on bibliometric indicators
![]()