Despite common belief, atomic weights are not necessarily constants of nature. Scientists’ ability to measure these values is regularly improving, so one would expect that the accuracy of these values should be improving with time. It is the task of the IUPAC (International Union of Pure and Applied Chemistry) Commission on Isotopic Abundances and Atomic Weights (CIAAW) to regularly review atomic-weight determinations and release updated values.
According to an evaluation published in Pure and Applied Chemistry [1], even the most simplified table abridged to four significant digits needs to be updated for the elements selenium and molybdenum. According to the most recent 2015 release of “Atomic Weights of the Elements” [2], another update is needed for ytterbium.
Many Standard Atomic Weights Are Not Constants of Nature
Although many of us were taught that atomic-weight values found on the periodic table in our chemistry classrooms are constants of nature, it has been known for more than half a century that atomic weights of many elements are not constants of nature. However, only in the past few years was the IUPAC Table of Standard Atomic Weights updated to clarify this fact by replacing single-value atomic-weight values by atomic-weight intervals (see [3] and [4]).
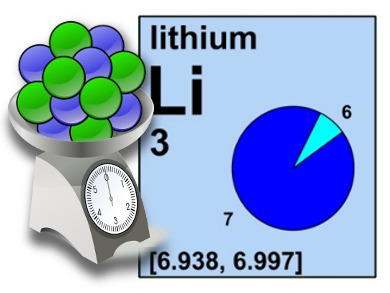
For example, starting in the 2009 Table, the atomic weight of lithium was changed from 6.941 ± 0.002 to [6.938, 6.997] to indicate that the atomic weight of naturally occurring lithium samples, which includes normal chemical reagents, can range between 6.938 and 6.997, depending upon the source of the material (see Fig. 1). If one knows the source of lithium in a sample, one may have a more accurate value for the atomic weight. However, if the source is unknown, the value of the atomic weight could be at one or the other extreme.
Today, the standard atomic-weight values of twelve elements are best reported as intervals. These are hydrogen, lithium, boron, carbon, nitrogen, oxygen, magnesium, silicon, sulfur, chlorine, bromine, and thallium. Some users of atomic-weight data need a fixed value, such as for trade and commerce. For these purposes, the CIAAW provides conventional atomic-weight values for these elements (see Tab. 1).
|
Table 1. Conventional atomic weights and atomic-weight intervals of selected elements abridged to four digits [1]. |
|||||||||||||||||||||||||||||||||||||||||||||||||||||||||||||||||
|
Atomic Weights for Elements with More than One Stable Isotope
An atomic weight of an element E, symbol Ar(E), is the sum of the products of the relative atomic mass and the fraction of the amount of each stable and long-lived radioactive isotope of that element in a given sample. Because relative atomic masses are known with high accuracy, the atomic weights of elements having only one stable or long-lived radioactive isotope are also known with high accuracy. For example, gold-197 (197Au) is the only stable isotope of gold and its relative atomic mass (atomic weight) is Ar(197Au) = 196.96657, expressed to 8 digits. Thus, gold’s atomic weight, Ar(Au), can be expressed relatively accurately as 196.96657, which would be rounded to 197.0 in a four-digit table.
For elements with more than one stable or long-lived radioactive isotope, the accuracy of an atomic weight is substantially lower because the accuracy with which the fractional amounts of each isotope in a given specimen can be determined is lower. For example, lithium has two stable isotopes, 6Li and 7Li, with relative atomic masses, respectively, of 6.0151229 and 7.0160034, expressed to 8 digits.
However, the best measurement of the fractions of 6Li and 7Li in a specimen gives 0.07589 ± 0.00024 and 0.92411 ± 0.00024, respectively, which yields an atomic weight, Ar(Li), of:
Ar(Li) = 6.0151229 × (0.07589 ± 0.00024) + 7.0160034 × (0.92411 ± 0.00024) = 6.9400 ± 0.0002
Thus, analytical uncertainty in the measurement of the amounts of the two lithium isotopes in a sample limits the atomic weight of lithium to an accuracy of only five digits.
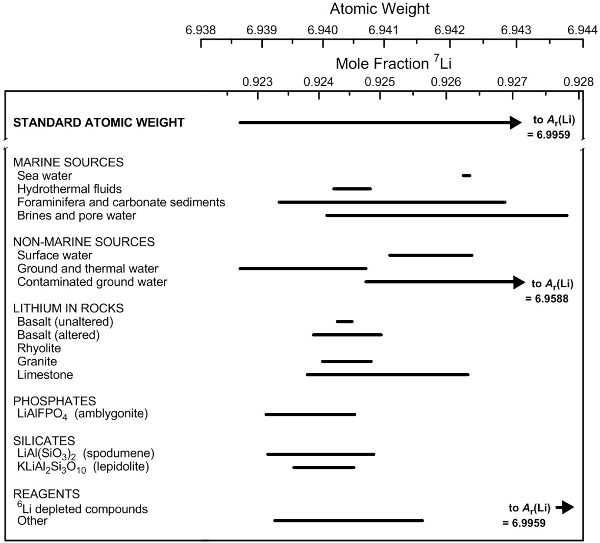
The natural variation of the fraction of the amount of 7Li in a sample further limits the accuracy of the atomic weight. This is shown in Figure 1 for selected lithium-bearing materials. The fraction of the amount of a specified isotope in a sample is also called the mole fraction, the amount fraction, the atom fraction, or the isotopic abundance. Note that atomic weights are dimensionless quantities because relative atomic masses are scaled to one-twelfth the mass of a carbon-12 atom.
|
|
|
Figure 1. Variation in atomic weight with mole fraction of 7Li in some lithium-bearing materials (modified from [3]). |
Atomic Weights to Four Significant Figures
Forty years ago, the first Table of Atomic Weights to Four Significant Figures, based on the 1975 values, was developed under guidance of the CIAAW and published by the IUPAC Committee on Teaching of Chemistry [5]. In more recent years, similar tabulations were also published in Pure and Applied Chemistry, along with detailed Commission biennial reviews. However, the Commission recognized that the details and number of significant digits reported in the full Table of Standard Atomic Weights (e.g., up to 9 digits for aluminium (aluminum) or fluorine, or even 10 digits for caesium (cesium)) exceeds the need and interests of many users. The abridged table was also published with the expectation that subsequent changes would be minimal.
|
Table 2. Table of four-digit atomic-weight values for selected elements through the years. |
|||||||||||||||||||||||||||||||||||||||||||||||||||||||||||||||||||||||||||||||||
|
|||||||||||||||||||||||||||||||||||||||||||||||||||||||||||||||||||||||||||||||||
|
(*, value may differ from the atomic weights of the relevant elements in some normal materials because of a variation in the isotopic abundances of the element’s stable isotopes; uncertainty in standard atomic weight larger than ±1 appears in parentheses, following the last significant digit to which it is attributed.) |
The expectation of minimal changes in atomic-weight values was a valid prediction. Except for five elements (lithium, boron, sulfur, titanium, and germanium), the four-digit standard atomic-weight values have not changed over five decades by more than one digit in the last place. For three of these elements (lithium, boron, and sulfur), the differences are due to recognition of natural isotopic fractionation in normal materials. The improvements in the two others, titanium and germanium, are due to the use of mass spectrometry to determine more accurate isotopic abundances and thus more accurate values of atomic weight [7].
Reviewing the values reported in the 2013 table [1] caused the update of two four-digit standard atomic-weight values for selenium and molybdenum. The recent 2015 release [2] triggered an additional update for the element ytterbium. In these cases, the revisions are due to improved measurements using high-accuracy mass spectrometry.
If you routinely consult a table abridged to four significant digits, ensure you update your table with these latest values.
Acknowledgements
The comments of Ms. Kerri Miller (University of Calgary, Canada), Professor Peter Atkins (Lincoln College, U.K.), Professor Ian Mills (University of Reading, U.K.), and Professor Peter Mahaffy (The King’s University, Edmonton, Canada) are appreciated. The support of the U.S. Geological Survey National Research Program made this report possible.
Authors
Tyler B. Coplen, U.S. Geological Survey, Reston, Virginia, USA, E-mail: [email protected]
Fabienne Meyers, International Union of Pure and Applied Chemistry, c/o Boston University, Chemistry Department, Boston, MA, USA, E-mail: [email protected]
Norman E. Holden, National Nuclear Data Center, Brookhaven National Laboratory, Upton, New York, USA, E-mail: [email protected]
References
[1] Juris Meija, Tyler B. Coplen, Michael Berglund, Willi A. Brand, Paul De Bièvre, Manfred Gröning, Norman E. Holden, Johanna Irrgeher, Robert D. Loss, Thomas Walczyk, Thomas Prohaska, Pure Appl. Chem. 2016, 88, 265–291. https://doi.org/10.1515/pac-2015-0305
[2] IUPAC press release, 24 August 2015. Link
[3] M. E. Wieser, T. B. Coplen, Pure Appl. Chem. 2011, 83, 359–396. DOI: 10.1351/PAC-REP-10-09-14
[4] T. B. Coplen, N. E. Holden, Chemistry International 2011, 33 (2), 10–15. Link
[5] IUPAC Committee on Teaching Chemistry, Int. News Chem. Educ. (June 1975), 2.
[6] A. E. Cameron, E. Wichers, J. Am. Chem. Soc. 1962, 84, 4175–4197. https://doi.org/10.1021/ja00881a001
[7] J. R. de Laeter et al., Pure Appl. Chem. 2003, 75, 683–800. https://doi.org/10.1351/pac200375060683