In Part 1, we traced the path from the licorice plant (Glycyrrhiza glabra) to the licorice wheel. Although it has proven itself over the centuries as a folk remedy for gastric disorders and diseases of the upper respiratory tract, the active ingredient in licorice, glycyrrhetinic acid, was not isolated in its pure form and characterized until 1936.
The subsequent determination of its structure was nearly a solo effort on the part of Leopold Ružička and his research group. In Part 2, we accompanied him on his arduous journey from the molecular formula C30H46O4 to the structural formula.
In this final part of this article, we will compare how modern chemists determine the structures of such complex natural substances with the help of spectroscopic methods.
6 How Would Chemists Determine the Structure of Glycyrrhetinic Acid Today?
In addition to high-resolution mass spectrometry, the most commonly used tool in determining the structures of organic compounds is NMR (nuclear magnetic resonance) spectrometry. We are only able to superficially discuss the physical foundations of this process here (see Infobox 1). For a deeper understanding, interested readers should refer to introductory descriptions in the literature [34–36].
Infobox 1. NMR – The Principle.
(click here to expand)
The atomic nuclei of hydrogen and the carbon isotope 13C (natural occurrence 1.1 %) have magnetic moments that can align themselves to be parallel or antiparallel to an external magnetic field. It is possible to use electromagnetic radiation to induce transitions between these two orientations. This produces the NMR signal.
In a given magnetic field strength, each atomic nucleus has a characteristic resonance frequency range. Not all atomic nuclei have a magnetic moment. For example, 12C and 16O are magnetically inactive and cannot be measured by NMR spectroscopy. At a magnetic field strength of 11.7 Tesla, the resonance frequency of 1H nuclei is 500 MHz and that of 13C nuclei is 126 MHz.
The crucial thing for determining structures is that the resonance frequency is influenced by the chemical environment of the atomic nucleus. This is called chemical shift. The observed differences are extremely small—only a few ppm (parts per million = 10-6)—but this is enough to draw clear conclusions about the chemical environment of an atomic nucleus based on the position of its signal.
Distortionless Enhancement by Polarization Transfer (DEPT)
DEPT (Distortionless Enhancement by Polarization Transfer) spectra provide information by which the 13C signals of primary, secondary, and tertiary C atoms can be differentiated. This is used to differentiate between CH3, CH2, and CH groups. In three different experiments, the proton impulse is adjusted to 45°, 90°, or 135°. The different pulses depend on the number of protons bound to a given carbon atom.
 |
|
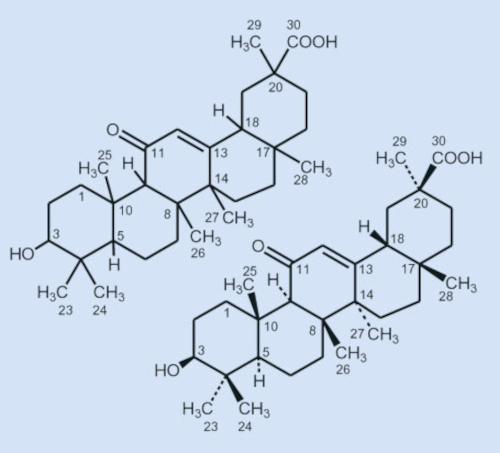
Figure 9. After years of arduous degradation and rearrangement reactions, Ružička and his group were finally able to determine the constitution of glycyrrhetinic acid in 1943 (left). |
6.1 13C NMR
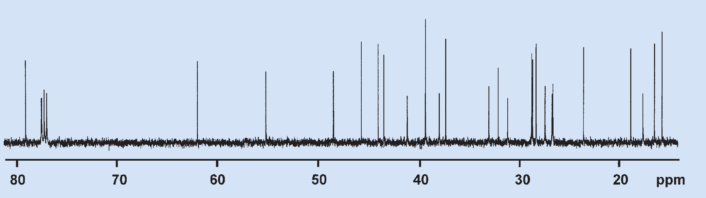
The 13C NMR spectrum of glycyrrhetinic acid (see Fig. 10) has 30 signals, of which seven are from primary (p), nine from secondary (s), five from tertiary (t), and nine from quarternary (q) C atoms. There are, thus, 44 hydrogen atoms directly bound to C atoms, leaving two directly connected to O atoms. Some signal positions are so characteristic that the structural fragments they correspond to can be identified with little experience: a carboxyl group with a signal at 181 ppm (q), an α,β-unsaturated ketone group (–CO–CH=C) with signals at 200 (q) and 128 (t) ppm, and a secondary alcohol group (–CHOH) with a signal at 79 ppm (t). All functional groups can be identified in the 13C NMR spectrum.
 |
|
Figure 10. 13C NMR spectrum of glycyrrhetinic acid. |
A structural determination is a puzzle that can be put together in an infinite number of ways. The route taken depends on the experience and knowledge of the evaluator. In the approach chosen here, we wanted to reach the destination as directly as possible. Many spectroscopic details obvious to an expert will be omitted from this discussion.
6.2 1H NMR
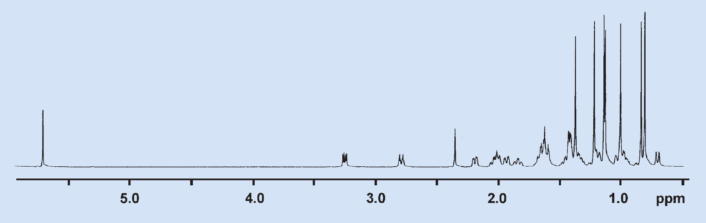
In the 1H NMR spectrum, 7 methyl groups appear as sharp singlets (see Fig. 11). There is no magnetic interaction (spin–spin coupling) to other hydrogen atoms, so all methyl groups must be bound to quarternary C atoms. If a methyl group were part of a structural element such as CH3CH, the signal for the methyl group would be split into a doublet. This type of splitting can be seen in many of the other 1H signals in the 1H NMR spectrum.
 |
|
Figure 11. 1H NMR spectrum of glycyrrhetinic acid. |
6.3 Two-Dimensional NMR Spectroscopy
With some practice, it is naturally possible to get far more structural information from the NMR spectra. However, two-dimensional (2D) NMR is a more direct method.
The 1D NMR spectra of large molecules are usually very complex because many nuclei are interacting with each other. By using 2D NMR spectroscopy, it becomes possible to resolve and interpret such spectra. The trick behind this measurement method, based primarily on the work of Richard Ernst (Nobel Prize 1991) [37], is that 2D NMR spectra have cross peaks if there is a magnetic interaction between the two atomic nuclei in question.
Today, a wide array of different 2D NMR techniques is available to us [38,39]. The best-known of these is the COSY experiment.
6.3.1 HMQC (Hetero Multiple Quantum Correlation) Technique
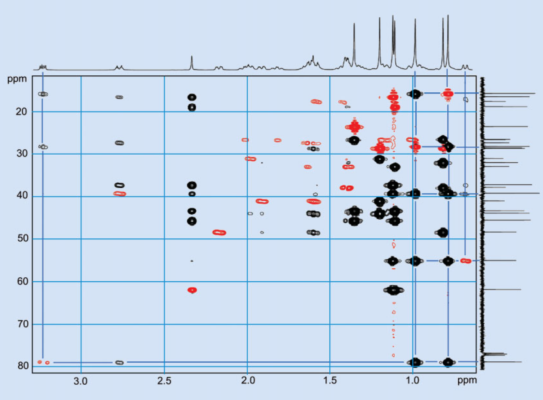
For the structural problem we are trying to solve here, a two-dimensional CH-correlated NMR spectrum is the most informative. The CH-correlated spectra are measured with the HMQC (Hetero Multiple Quantum Correlation) technique. In these plots, the 13C spectrum makes up one frequency axis, while the 1H NMR spectrum makes up the second.
The measurement parameters are selected such that cross signals appear at the intersections between 13C and 1H signals only if the C and H atoms in question are connected via only a few bonds. Observant readers will suspect that this “measurement technique” is much more complicated than it appears to be. Indeed, during these measurements, a complex sequence of high-frequency pulses plays a dizzying game with the 1H and 13C magnetizations, a game with complex rules that can unfortunately only be understood with a solid background in quantum theory.
 |
|
Figure 12. Two-dimensional CH-correlation NMR spectrum. |
The cross-peaks for signals with a direct C–H bond are red in Figure 12. If there are two or three bonds between the C and H atoms, the cross-peaks are shown in black. This coloring is not arbitrary. The two different types of cross-peaks can be differentiated through measurement: The coupling constants between directly bound C and H atoms are about 130 Hz, whereas couplings that occur over a distance of two or three bonds are only between 2 and 10 Hz, an order of magnitude smaller. It is not easily possible to differentiate between coupling occurring through two and three bonds.
We will proceed step by step:
Step 1
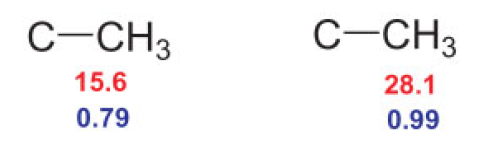
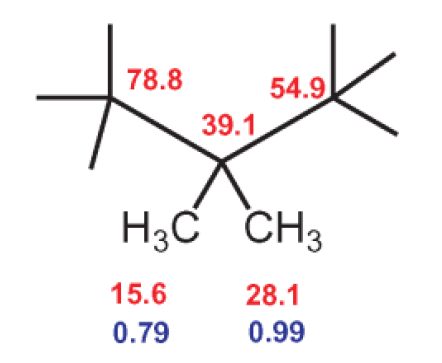
Let’s look at the C–H cross-peaks of the 1H methyl signals at 0.79 and 0.99 ppm in Figure 12. The red cross-peaks establish that the corresponding 13C signals of the directly bound C atoms are at 15.6 and 28.1 ppm, respectively. This means we have the following two structural fragments:
Step 2
Between the 1H nucleus at 0.79 ppm and the 13C nucleus at 28.1 ppm, as well as the proton at 0.99 ppm and the 13C signal at 15.6 ppm, the cross-peaks indicate a magnetic interaction through two or three bonds, meaning that the two methyl groups must be bound to a common C atom.
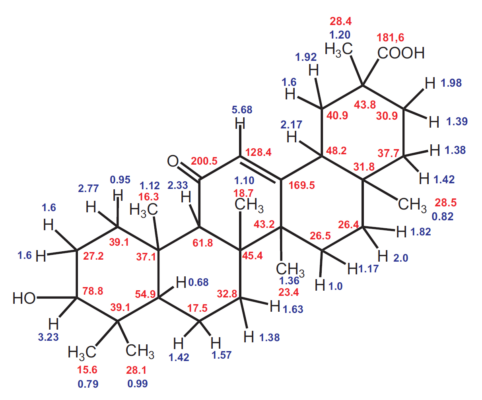
Which one? Figure 13 shows that the proton signals of both methyl groups have a cross-peak with the quarternary 13C signal at 39.1 ppm. In short, we have: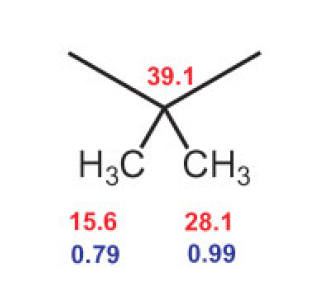
 |
|
Figure 13. Structural formula of glycyrrhetinic acid with 1H and 13C NMR signals (blue and red, respectively). |
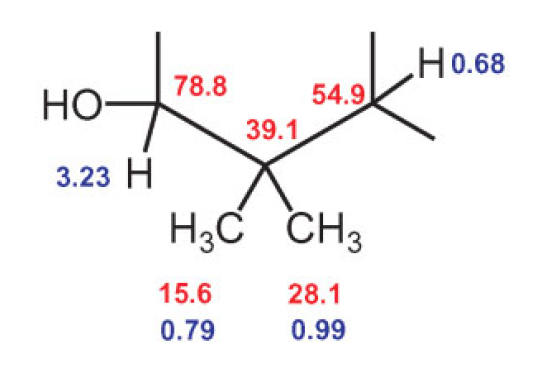
Step 3
That is a good start! Let us further examine the correlations of the proton signals from the two methyl groups at 0.79 and 0.99 ppm. Both correlate with 13C signals at 54.9 and 78.8 ppm (see Fig. 12).
Step 4
The 13C signals at 54.9 ppm and 78.8 ppm correspond to two tertiary C atoms, for which the signals of the directly bound protons are at 0.68 and 3.21 ppm, respectively (see Fig. 12). The 13C signal at 78.8 ppm and the corresponding 1H signal at 3.21 are both so strongly shifted that there must be a hydroxyl group bound to the C atom. This logic produces the following structure fragment:
Steps 5 to n
With a lot of scratch paper and patience, we can move from cross-peak to cross-peak and assign all the 1H and 13C NMR signals to atoms and determine how they are bound together (see Fig. 13).
As a result of our measurements, however, one signal assignment must be corrected: the 13C signals for C8 and C14 must be swapped relative to those given in the literature (see [40]).
All 1H and 13C NMR signals can be assigned to atoms [40] and their connections, and thus, the entire bonding framework can be determined. By using special NMR techniques, it is also possible to determine the spatial orientations of all substituents. The NMR spectroscopic studies confirm the structural formula shown in Fig. 9, which was initially determined entirely by chemical degradation reactions.
7 Conclusion
From licorice root to the licorice wheel and from the molecular formula to the structural determination of the constituent, it was a long road. It required the chemical expertise of Nobel Prize winners [37]: Leopold Ružicka, who determined the constitution; Derek Barton, whose work about the spatial structure of linked six-membered rings laid the foundation for its full structural determination, and Feodor Lynen and Konrad Bloch, whose experiments gave the isoprene rule a biochemical basis.
The development of the spectroscopic methods that allow us to determine the structures of complex natural products like glycyrrhetinic acid within a few days was also the work of clever minds: Francis William Aston build the first mass spectrometer, Felix Bloch and Edward Mills Purcell made the first NMR spectrometer, and Richard R. Ernst introduced multi-dimensional NMR spectroscopy. The licorice wheel, thus, really packs a punch from a chemical point of view, and we should truly enjoy it with (chemical) reason.
Acknowledgments
I thank the Haribo Corporation, Bonn, Germany, for their cooperation and licensing of photographic materials. I thank Dr. E. Vaupel for her valuable help in combing through the library of the Deutsche Museum in Munich and Dr. Karl-Heinz Hellwich (Beilstein GmbH, Frankfurt, Germany) for his help in clarifying many questions of nomenclature. Special thanks also to Dr. A. Schäfer, FU Berlin, who spent many hours acquiring and evaluating NMR spectra, with only two bags of licorice wheels in thanks.
References
[34] J. Rudolph, Physikalische Methoden in der Chemie. Kernmagnetische Resonanz II, Chem. unserer Zeit 1967, 1, 116–121. https://doi.org/10.1002/ciuz.19670010405
[35] J. Rudolph, Physikalische Methoden in der Chemie: Kernmagnetische Stromquellen, Chem. Unserer Zeit 1967, 1, 77–83. https://doi.org/10.1002/ciuz.19670010304
[36] H. Friebolin, Ein- und mehrdimensionale NMR-Spektroskopie, Wiley-VCH, Weinheim, Germany, 1999.
[37] All Nobel Prizes, www.nobelprize.org. (accessed May 1, 2023)
[38] H. Friebolin, G. Schilling, Zweidimensionale NMR-Spektroskopie, Chem. unserer Zeit 1994, 28, 88–101. https://doi.org/10.1002/ciuz.199400010
[39] W. R. Croasmin, R. M. K. Carlson (Eds.), Two-Dimensional NMR-Spectroscopy, VCH, Weinheim, Germany, 1994.
[40] H. Duddeck et al., Carbon-13 nuclear magnetic resonance spectra. VIII—18α- and 18β-glycyrrhetic acid derivatives, Org. Magn. Reson. 1978, 11, 130–132. https://doi.org/10.1002/mrc.1270110307
The article has been published in German as:
- Die Lakritzschnecke,
Klaus Roth,
Chem. unserer Zeit 2004, 38, 202–207.
https://doi.org/10.1002/ciuz.200490046
and was translated by Caroll Pohl-Ferry.
The Licorice Wheel – Part 1
The root of the licorice plant is one of the oldest known remedies – we will take a deeper look at the chemistry of this healthy treat
The Licorice Wheel – Part 2
Let us accompany Leopold Ružička on his arduous journey from the molecular formula C30H46O4 to the structural formula
More about Ružicka’s research:
Pyrethrum: History of a Bio-Insecticide, ChemistryViews 2018. https://doi.org/10.1002/chemv.201800089
See similar articles by Klaus Roth published in ChemistryViews
![]()