Biotech crops reached 175 million hectares in 2013, the 18th year of commercialization of biotech crops
A graphical overview of current trends and developments in the chemical industry.
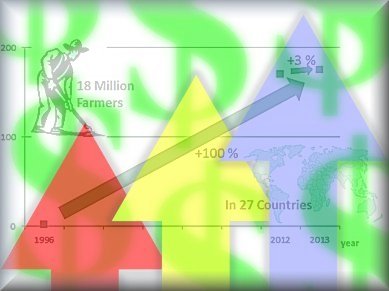
Plant Biotech Trends 2013

Nuclear Power Stations
Nuclear power is controversial, yet 68 new plants are under construction adding 65 GW to the global capacity of nuclear power

Chemical Industry in Finland
The chemical industry is Finland's largest export industry

Top Ten Chemical Companies in 2012
Worldwide, chemical companies saw slight decline in revenues in 2012

Fuel Cell Capacity and Cost Trends
Sales of fuels cells and hydrogen systems generated over $1 billion in 2012 and is forecast to increase

International Chemical Trade 2011 Data
The European Union (EU) remains the largest importer and exporter of chemicals despite a decrease in competitiveness

Plant Biotech Trends 2012
Biotech crops reached 170 million hectares in 2012

Greenhouse Gas Emissions and the Chemical Industry
Long-term data show that the EU chemicals industry has significantly reduced its greenhouse gas (GHG) emissions

Industrial R&D Investment 2011 Data
EU based companies increased R&D investments by more than the world average, despite lagging behind in sales and profits growth

Shale Gas: Impact on the Petrochemical Industry
Development of shale oil and gas has opened new sources of oil, natural gas, and key petrochemical feedstocks