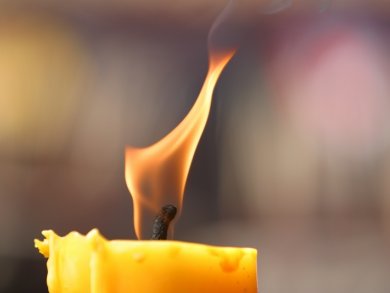
Warm candlelight confers upon one’s home a festive radiance without which the Advent period would lose much of its allure. Admiring a burning candle, perhaps surrounded by sprays from a fir tree, cautiously blowing on the flame, and watching as liquid wax drips, is a fascinating treat for almost everyone.
6. Zones of a Flame
In the gaseous phase, and at temperatures in the interior of a candle flame up to 1400 °C, there exist highly energetic intermediates that look quite exotic to most of us as they will not be found in introductory textbooks.
Four distinct zones can be differentiated visually (see Fig. 1):
- A dark Zone I in the interior of the flame, where paraffin molecules are mainly subjected to thermal cleavage.
- The blue-green luminous region (Zone II) of the principal reaction zone along the flame’s lateral and lower edges.
- The only slightly luminous part of the reaction zone (Zone III), found at the upper and outer edges.
- The pale-yellow and luminous Zone IV, extending from the center to the visible tip of the flame.
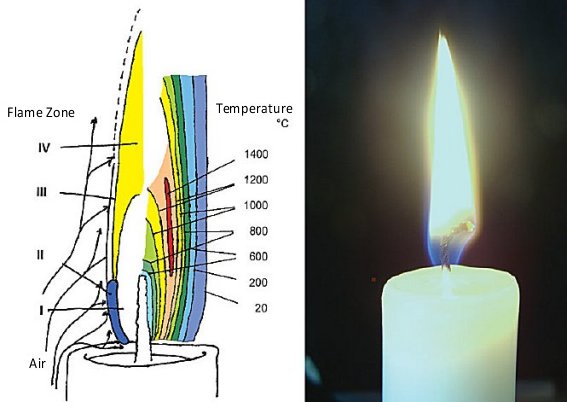
Figure 1. A candle flame.
We now trace the fate of individual wax molecules in a burning candle. In Zone I, wax vaporizes directly from the surface of the wick (see Fig. 1). Despite the small gap separating the wick from hot reaction Zones II and III, the temperature at the wick itself is “only” 600 °C, since the evaporation of wax is highly endothermic.
Wax vaporization is easy to demonstrate by holding one end of a glass tube in the lower part of Zone I. Outside the actual flame we see deposition of unconsumed wax, which can ultimately be ignited (see Fig. 2).
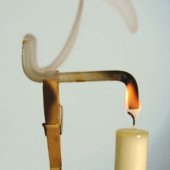
Figure 2. Experiment carried out by Michael Faraday (1861).
6.1 Zone I
The temperature in the dark Zone I increases as one moves either up or toward the outside, since the distance to the hot reaction zones thereby decreases. Here no oxygen is available, so increasing temperature leads only to more thermal decomposition. For simplicity, let us assume that the combustible material in our candle is paraffin, with a molecular formula CnH2n+2.
Figure 3. Thermolysis of long-chain hydrocarbons.
In the first reaction step, C–C bonds break to produce pairs of radicals (see Fig. 3). These hydrocarbon radicals are highly reactive: subsequent elimination of hydrogen atoms leads to olefins, elimination of ethylene gives shorter radicals, and finally, diradicals can cyclize, after which more hydrogen atoms can be eliminated, etc. Overall there is a confusing tangle of reactions, leading to a mixture of smaller, unsaturated aliphatic, alicyclic, and aromatic hydrocarbons. The original CnH2n+2 molecules are converted into unsaturated and thus relatively hydrogen-deficient substances.
The free hydrogen atoms that result might, on the one hand, generate new hydrocarbon radicals, or, due to their tiny atomic mass, rapidly diffuse into the reaction zones. In any case, in the hot parts of Zone I, any wax molecules are thermally cleaved, so in the flame of a candle, no intact wax molecules will come in contact with oxygen!
6.2 Reaction Zones
Now we come to the chemical heart of a candle flame: the reaction zones. Here, pyrolytic decomposition products from wax molecules, as they arrive from the interior, encounter oxygen diffusing in from the surroundings. The highly exothermic oxidation reactions that take place here are limited only by the supply, through diffusion, of appropriate reaction partners. The flame of a candle thus corresponds to a typical diffusion flame.
A candle flame that is not smoking is completely enclosed by its reaction zones. So why is it that the lower part of the reaction region, Zone II, appears to burn blue-green, while Zone III seems to give off no light whatsoever, even though in all the reaction zones exactly the same processes are taking place? The answer is rather surprising: this is an optical illusion! The bright yellow emission from Zone IV completely outshines the weak, bluish light from the adjoining reaction zones. As a result, our eyes are only able to distinguish bluish light coming from Zone II, the region farthest removed from the bright yellow source.
Two unusual molecules betray their existence through this bluish light, a color familiar to us already from the natural-gas flame of a gas stove or a Bunsen burner. In these devices, natural gas is mixed ahead of the flame with air, and it is the resulting mixture that is combusted. One refers in this case to a “premixed flame”, whereas a candle flame is instead a strict “diffusion flame”, with air supplying the oxygen necessarily diffusing in from the environment. The characteristic band spectrum produced by such a flame [6] is derived from two molecular sources. The first, producing a violet emission at 432 nm, is due to electronically excited CH* molecules, which arise in the reaction zones as follows [7]:
![]()
Meanwhile, blue-greenish light comes similarly from another electronically excited molecule, namely C2, with its “Swan bands”, producing radiation in the visible at 436, 475, and 520 nm. Excited C2 molecules form mostly via reactions of oxygen atoms with higher hydrogen-deficient hydrocarbon radicals. Yet another emission can be detected at 315 nm in the UV region, due to OH* radicals on the oxygen-rich side of the reaction zone and derived this time from the reaction:
All the excited species spontaneously release their excess energy in the form of light (chemiluminescence).
The oxidation reactions in reaction Zones II and III also follow a surprising course. The primary oxidizing agent here turns out to be not oxygen itself, but rather the hydroxyl radical OH [8]. As in the oxyhydrogen (“Knallgas”) reaction, OH radicals arise according to equation (4) by way of hydrogen atoms, re-created among other ways in the succeeding reaction (5).
![]()
One recognizes here a kind of reaction chain, which becomes even more effective as a consequence of the oxygen atoms formed in the first step (see Eq. (4)). This chain is the actual motor that drives a hydrocarbon flame. The concentration of OH radicals is highest at the outer edge of the reaction zones, which is why one finds there also the highest temperature, ca. 1400 °C.
6.3 Zone IV — The Most Beautiful Part of a Candle Flame
We finally come to the most beautiful part of a candle flame: Zone IV, which is the zone responsible for bathing our parlors in that familiar warm, yellow glow. Where does the corresponding light come from? This is another place where Faraday managed to devise a simple but useful experiment: If we illuminate our burning candle with a strong lamp, and examine the resulting shadow (see Fig. 4), the only thing that clearly shows up is shadow associated with Zone IV.
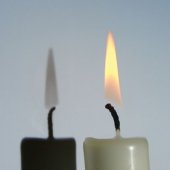
Figure 4. Experiment by Michael Faraday (1861).
It is curious that in this shadow what we see as the darkest part derives from that portion of the flame which is actually the brightest, as Faraday noted when he first carried out his experiment. A black shadow can only occur here if relatively large particles are present, ones that absorb all the wavelengths of visible light. Faraday was able to establish the general nature of these particles in Zone IV of the flame by directing some of them outward through an outflow tube (see Fig. 5); they turned out to be soot.
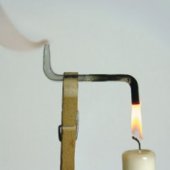
Figure 5. Experiment by Michael Faraday (1861).
So how can radiance arise in Zone IV from soot? In the hotter parts of the oxygen-free Zone I, there form, at high temperature, carbon-rich molecules that cannot be described through simple structural formulas. Initially, these primary soot particles have roughly the composition (C3H)n, and each is actually made up of several thousand carbon atoms. The empirical formula suggests cyclic, highly unsaturated, polycyclic aromatic structural elements. The primary soot particles grow through agglomeration, dehydration, and coagulation to as much as a few million carbon atoms [9]. The resulting large soot particles begin in Zone IV at temperatures above 1200 °C to glow. In other words, yellow candlelight is a direct result not of a chemical reaction, but rather of solid soot particles thermally transforming energy into light, in which the yellow and red spectral elements are more intense than the blue, causing our eyes to register the candle flame as yellow.
Thermally-produced soot particles from the oxygen-deficient Zone IV are oxidized to CO or CO2 in the reaction zones lying above. Combustion of such soot particles is complete, however, only if the temperature is at least 1000 °C. If one cools the upper parts of a candle flame, perhaps by blowing in air, or with the aid of a draft, then the soot is no longer able to react completely, and the candle begins to smoke.
7. Emissions
The chief products from candle combustion are indeed carbon dioxide and water, but other compounds are formed as well, albeit in extremely small quantities. The chemical structures and amounts of these byproducts are actually now of considerable interest, since we have learned how crucial it can be to ensure that people in a room — illuminated by candlelight, for example — are not subject to inappropriate health risks. Table 2 provides an overview of some minor products found to arise in this situation.
Table 2. Pollutant concentrations in environmental air after the burning of candles.
Observed air concentrations (in ng/m3) of various compounds subsequent to burning the equivalent of 600 g of candle mass, or one cigarette, in a room (50 m3) where no air exchange is taking place [11].
A study carried out in Germany by the Rhineland Technical Control Board (TÜV Rheinland) [10] examined particulate matter present in the air of the St. Boniface Church in Wiesbaden, Germany, both during and apart from church services, and both with and without the contributions of 50–115 burning paraffin votive candles. One purpose of the investigation was to establish the potential role of candle flames on the surface-soiling of works of art (stained-glass windows, sculptures, altar paintings, etc.), but another was to assess possible health concerns.
The results were unambiguous: dust particles collecting in the filters employed in the study were attributable almost exclusively to the church’s heating system, or to visitors to the church; the influence of candles proved to be negligible. Even with candles fabricated from colored wax, or ones that had been dipped in dyes, it was not possible to affirm the existence of any health risk [11]. Only after burning 30 scented candles with an unusually high scent-oil content of 8 % for four hours in an airtight room were investigators able to detect the presence, for example, of polychlorinated dioxins and furans, and even then only at an order of magnitude equivalent to the maximum allowed workplace concentration [12].
Nevertheless, one should always strive to maintain smoke-free conditions when using candles, if only because soot particles otherwise released would eventually soil everything they encountered. In addition, soot always harbors small amounts of undesirable materials, among which polycyclic aromatic hydrocarbons would be regarded as the most dangerous. At the same time, we can conclude that in neither a church- nor a home-setting would there appear to be any reason for associating use of candles with any sort of health risk.
I wish to express my sincere thanks to the following colleagues for their tremendously effective help in my efforts to tackle this difficult “subdivision” of chemistry: Dr. Daniel L. Dietrich, NASA’s John H. Glenn Research Center, Ohio, USA, Dr. K.-H. Hellwich, Beilstein GmbH, Frankfurt, Germany, Dr. M. Matthäi, Sasol Wax, Hamburg, Germany, and most especially Professor K.-H. Homann, Technical University Darmstadt, Germany.
In addition, I am also deeply indebted to the Verband Deutscher Kerzenhersteller e.V. (Association of German Candle Makers), Frankfurt, for extensive reference material on the burning characteristics of candles. I wish also to acknowledge and thank NASA’s John H. Glenn Research Center for photos taken in the absence of gravity.
References
[6] R. Mavrodineanu, H. Boiteux, Flame Spectroscopy, Wiley, Chichester, UK, 1965.
[7] A.G. Gaydon, H.G. Wolfhard, Flames, Their Structure, Radiation and Temperature, 3rd Edition, Chapman & Hall Ltd., London, UK, 1970.
[8] K.-H. Homann, Fulleren- und Rußbildung – Wege zu großen Teilchen in Flammen, Angew. Chem. 1998, 110, 2572–2590. https://doi.org/10.1002/(SICI)1521-3757(19980918)110:18<2572::AID-ANGE2572>3.0.CO;2-B
[9] K.-H. Homann, H.G. Wagner, Bild der Wissenschaften 1970, 7, 762.
[10] Report of the Messstelle für Luftreinhaltung des TÜV Rheinland (Measuring station for air pollution of the Rhineland Technical Control Board) No. 539 / 777091, April 1999.
[11] Report of results from Ökometric GmbH and the Bayreuther Institut für Umweltforschung (Bayreuth Institute for Environmental Research), October 1994. Link
[12] Report of Results from Ökometric GmbH and the Bayreuther Institut für Umweltforschung, October 1997. Link
Prof. Klaus Roth
Freie Universität Berlin, Germany.
The article has been published in German in:
and was translated by W. E. Russey.
Chemistry of the Christmas Candle — Part 1
When we light a candle, the chemistry we are pursuing is not only especially beautiful, but also especially complex chemistry
Chemistry of the Christmas Candle — Part 3
In this last part we consider a candle burning in the absence of gravity
Other articles by Klaus Roth published by ChemistryViews magazine:
- In Espresso — A Three-Step Preparation
Klaus Roth proves that no culinary masterpiece can be achieved without a basic knowledge of chemistry
DOI: 10.1002/chemv.201000003 - In Chocolate — The Noblest Polymorphism
Klaus Roth proves only chemistry is able to produce such a celestial pleasure
DOI: 10.1002/chemv.201000021 - In Sparkling Wine, Champagne & Co
Klaus Roth shows that only chemistry can be this tingling
DOI: 10.1002/chemv.201000047 - In Chemistry of a Hangover — Alcohol and its Consequences
Klaus Roth asks how can a tiny molecule like ethanol be at the root of so much human misery?
DOI: 10.1002/chemv.201000074 - In The Chemist’s Fear of the Fugu
Klaus Roth shows that the chemist’s fear of the fugu or pufferfish extends as far as the distinctive and intriguing poison it carries
DOI: 10.1002/chemv.201000104 - Video Interview with Klaus Roth